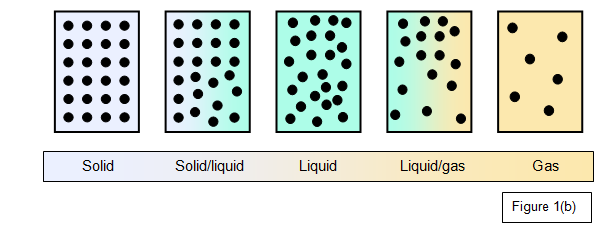
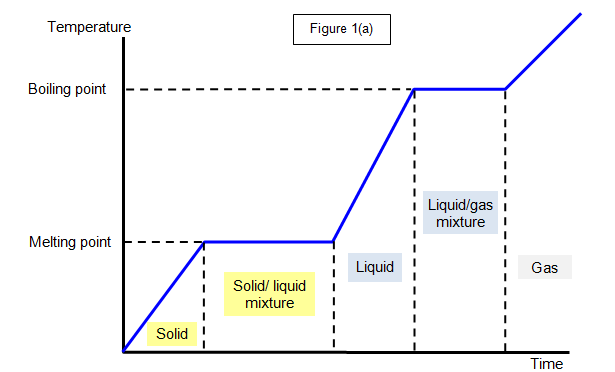
The graph shows the change in temperature of a
substance as it is heated steadily. It starts off as a solid, melts (changes to a liquid) and
finally boils (changes to a gas). The diagrams represent the arrangement of molecules in the
substance at various stages.
Notice:
(a) The molecules become more disordered as
these changes take place
(b) There is no temperature change WHILE the substance is
changing from a solid to a liquid or from a liquid to a gas