USING MOTION GRAPHS
It is often a lot easier to describe how an object is
travelling by drawing a graph of its motion. The example below shows how the velocity of a girl
travelling in a car might change on part of her way to school.
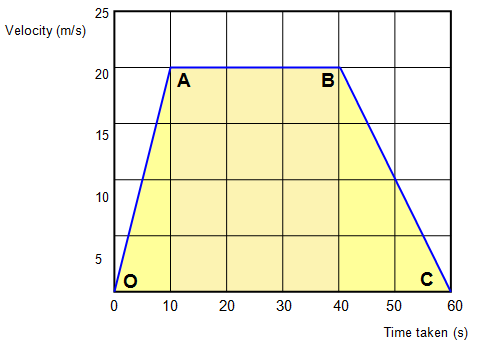
We can describe the motion of the car in the three different parts
of the journey:
(a) O to A - the velocity increases steadily from 0 m/s to 20 m/s in 10
seconds.
(b) A to B - the velocity stays the same at 20 m/s for the next 30s
(c) B to C -
the velocity decreases to 0 m/s in 20s.
Using: distance = average velocity x
time
Distance travelled AB = 10 x 10 = 100m
Distance travelled AB = 20 x
30 = 600m
Distance travelled BC = 10 x 20 = 200m
Total distance travelled
OC = 900m
But this is the AREA under the line.
This is always true no matter
how the object moves.
The area under the line in a velocity time graph is the distance travelled.
PROBLEMS
Plot graphs of the motion of the three vehicles and use them to work out the distances.
1. Lorry 0m/s to 15m/s in 10s, constant velocity for 30s, slows down to a stop after a further 15s.
Find the distance from:
(a) 10s to 35s and
(b) 40s to 55s.
2. Car - 0m/s to 25m/s in 15s, constant velocity for 30s, slows down steadily to a stop 65s after the start.
Find the distance travelled from 0s to 65s.
3. Sprinter - 0m/s to 10m/s in 2.0s, constant velocity for 8s, slows down steadily to rest in 3s.
Find the total distance travelled.