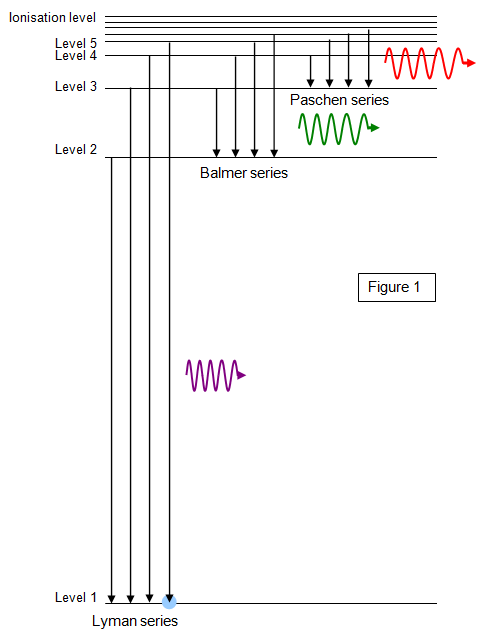
The spectrum of hydrogen contains distinct groups of lines known as spectral series. These are shown in Figure 1 and represent groups of electron transitions that end on levels n = 1, 2, 3, 4 and so on.
The series ending on n = 1 shows the largest energy transitions and gives lines in the ultraviolet region of the spectrum. This is known as the Lyman series.
The series ending on n = 2 lies mostly in the visible region of the spectrum and is called the Balmer series.
Other series ending on n = 3 (Paschen series), n = 4 (Brackett series), n = 5 (Pfund series) and above lie in the infrared region. Notice how the lines in a given spectral series get closer together as the wavelength decreases, reach¬ing a so-called series limit at the short-wavelength end.