At the centre of the
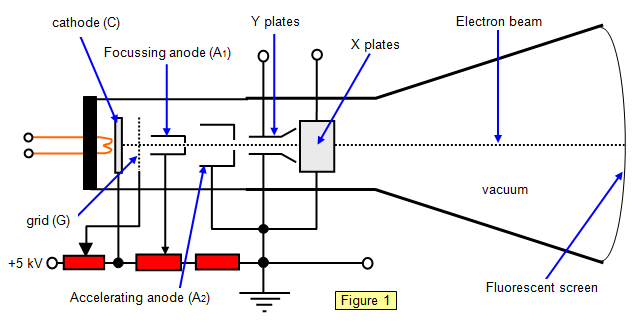
instrument is a highly evacuated cathode ray tube with the following features:
(a) a
heated cathode C to produce a beam of electrons - a typical beam current is of the order of
0.1 mA;
(b) a grid G to control the brightness of the beam;
(c) an accelerating
anode A2 - a typical potential difference between A2 and the cathode would
be about +1000 V;
(d) a pair of plates Y1 and Y2 to deflect the beam in
the vertical direction;
(e) a pair of plates X1 and X2 to deflect the beam in
the horizontal direction;
(f) a fluorescent screen F on which the beam of electrons
falls - in many modern oscilloscopes this is coated with zinc sulphide, which emits a blue
glow when electrons collide with it, while there are other coatings that glow for some seconds
after the beam has passed so enabling transient events to be seen more clearly;
(g) a
graphite coating to shield the beam from external electric fields and to provide a return path
for the electrons (see below);
(h) a mumetal screen which surrounds the tube and shields
it from stray magnetic fields.
The focusing and accelerating systems are connected
at different points along a resistor chain. Focusing is achieved by varying the voltage applied
between the two anodes A1 and A2.
Since secondary electrons are
emitted from the screen when the electron beam hits it, the phosphor coating of the screen
and the inner graphite layer of the tube are both earthed to prevent a large build-up of static
charge on the tube.
In the double beam oscilloscope there are two Y plates with an
earthed plate between them to split the beam into two. Two traces are then observed on the
screen. This can be most useful when comparing phase differences or making lapsed time
measurements.
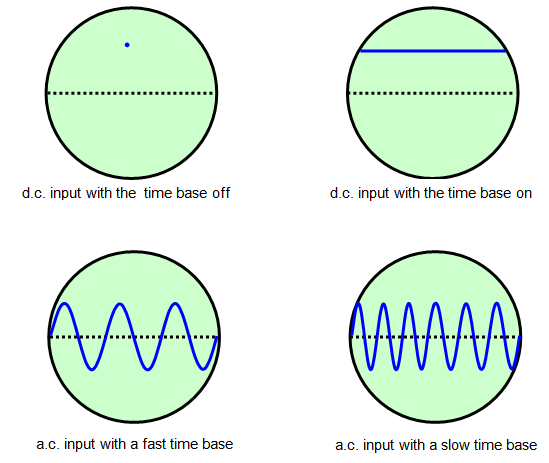
The time base circuit applies a saw-tooth waveform to the X-plates, as shown in Figure 2. The beam is moved from the left-hand side of the screen to the right during the time that the voltage rises to a maximum, and then is returned rapidly to the left as the voltage returns to zero. This fly-back time should be as short as possible.
Because the deflection of the spot depends on the voltage connected to the Y plates the CR0 can be used as an accurate voltmeter. The oscilloscope is also used in hospitals to look at heartbeat or brain waves, as computer monitors, radar screens and is also the basis of the television receiver.
The primary uses of the cathode ray oscilloscope
(CR0) are to measure voltage, to measure frequency and to measure phase.
(i) Measuring voltage
Because of its effectively infinite resistance, the CR0 makes an
excellent voltmeter. It has a relatively low sensitivity, but this can be improved by the use of
an internal voltage amplifier.
The oscilloscope must first be calibrated by connecting
a d.c. source of known e.m.f. to the Y-plates and measuring the deflection of the spot on the
screen. This should be repeated for a range of values, so that the linearity of the deflection
may be checked. The known e.m.f. is then connected and its value found from the deflection
produced.
Most oscilloscopes have a previously calibrated screen giving the deflection
sensitivity in volts per cm or volts per scale division. In this case a calibration by a d.c. source
may be considered unnecessary.
(ii) Measuring frequency
Using the calibrated
time base the input signal of unknown frequency may be 'frozen', and its frequency found
directly by comparison with the scale divisions.
Alternatively the internal time base may
be switched off and a signal of known frequency applied to the X-input. If the signal of
unknown frequency is applied to the Y-input, Lissajous figures are formed on the screen.
Analysis of the peaks on the two axes enables the unknown frequency to be
found.
(iii) Measuring phase
The internal time base is switched off as above and
two signals are applied as before. The frequency of the known signal is adjusted until it is the
same as that of the unknown signal. An ellipse will then be formed on the screen and the
angle of the ellipse will denote the phase difference between the two signals