Graphical solutions to equations
We are going to use the vibrating cantilever
as an example of the use of log graphs to determine an unknown equation for an
experimental arrangement.
The aim of this experiment is to investigate the factors
that affect the period of oscillation of a cantilever and also to suggest equations by which
they might be related.
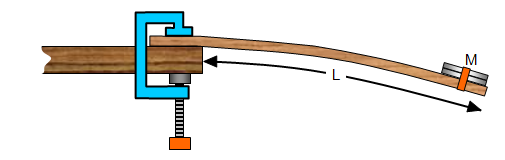
Lets
assume that you have done an experiment where you measured the length (L) of the beam,
the mass on the end of the beam (M) and the period of oscillation (T). You now want to find
an equation that links them but do not know the powers of the three quantities.
We
can write an equation as:
T = kM
zL
yWhere k is a
constant.
If you now take logs of both sides of the equation we have:
log T
= log k + z log M + y log L
Keeping the length of the beam fixed (i.e. L is constant at
a known value L
o) means that the equation becomes:
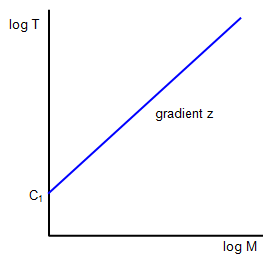
log T = z log M + C
1 where C
1 is a
constant (= log k + y log L)
Plotting a graph of log T against log M will give a straight
line of gradient z and intercept C
1 as shown in the diagram.
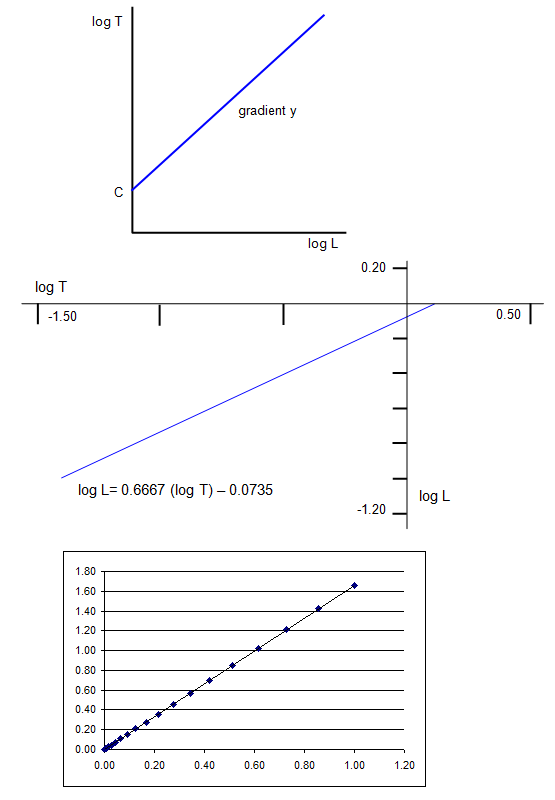
You now have to
determine the value of y.
Keeping the mass on the beam fixed (i.e. M is constant at
a known value M
o) means that the equation becomes:
Plotting a graph of
log T against log L will give log T = y log L + C
2 where C
2 is
a constant (= log k + z log M
o).
(Note that we already know the value of z
from graph 1 and so if M
o is known log M
o is also known.)
a
straight line of gradient y and intercept C
2 as shown in the diagram.
A VERSION IN WORD IS AVAILABLE ON THE SCHOOLPHYSICS USB