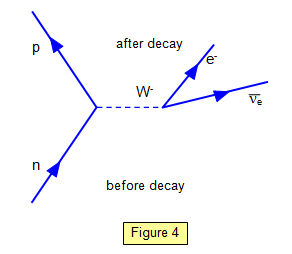
These were developed by the American physicist Richard Feynman as a way of showing the interaction between two sub-nuclear particles. They are a way of representing what is happening between the two particles during an interaction. (In the following Feynman diagrams time goes from bottom to top). Each point where lines come together is called a vortex and at each vortex charge, baryon number and lepton number must be conserved.
An example of a Feynman diagram for an
electromagnetic interaction is shown in Figure 1. It shows the interaction between two
electrons. In classical physics the electrons, both with a negative charge would repel each
other. The Feynman diagram shows that this repulsion occurs because of the interchange of
photons. Each electron emits a photon which is then absorbed by the other electron. The
photons in the interaction are known as virtual photons
because they are emitted and absorbed in a time so short that the uncertainty principle is not
violated. (To simplify the diagram only one of the virtual photons is shown).
A line which
begins and ends in the diagram (as with the wavy line in Figure 1) represents a virtual
particle.