
As time passes the
strength of a radioactive source gets weaker, its rate of decay (dN/dt) or activity gets smaller. A
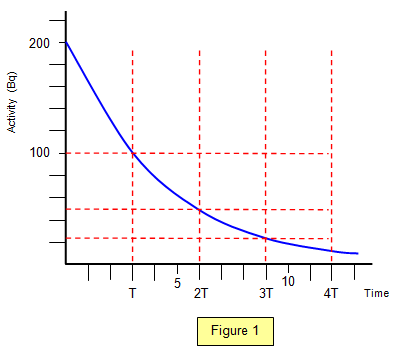
graph of activity against time is shown in Figure 1.
The rate at which an unstable nucleus
decays depends only on what type of nucleus it is. This decay is a random process. This means
that if we take a sample of unstable nuclei (for example 226Ra) we cannot know when any
individual nucleus is going to decay. However we can measure what we call the half life (T) for the
element in the sample.
For example, the half life of 226Ra is about 1600 years. So if
we start off with 1200 radium nuclei there will be 600 after 1600 years, 300 after 3200 years, 150
after 4800 years and so on. The number of radioactive radium nuclei remaining halves every half
life, in this example every 1600 years.
Knowledge of the half lives of radioisotopes is vital
in many situations, for example when they are used in medicine, in radioactive dating or when the
environment has been contaminated in a nuclear accident.
Some values of the half lives of
some well known radioisotopes are given in the following table:
| Isotope | Half life | Isotope | Half life | |
| Uranium 238 | 4.5x10⁹ years | *Strontium 90 | 28 years | |
| *Plutonium 239 | 2.4x10⁴ years | *Cobalt 60 | 5.26 years | |
| Carbon 14 | 5570 years | *Iodine 131 | 8.1 days | |
| Radium 226 | 1622 years | Radon 220 | 55 s | |
| *Caesium 137 | 30.2 years | Bismuth 214 | 1.6x10⁻⁴ s |
The activity of a sample is directly proportional to the
number of radioactive atoms in the sample and so we can use the half life to predict the activity of
a sample at any time in the future.
Since the activity halves every half life it will fall to one
half after one half life, a quarter after two, an eight after three and so on.
The original activity is Ao and the activity after n half-lives have gone by is A. The formula works not only for simple cases where n is a whole number (i.e. for one half life, two half lives etc) but also when n is any number (i.e. 1.2 half lives, 4.3 half lives and so on).