Another useful quantity is the binding energy per nucleon. It can be defined simply as:
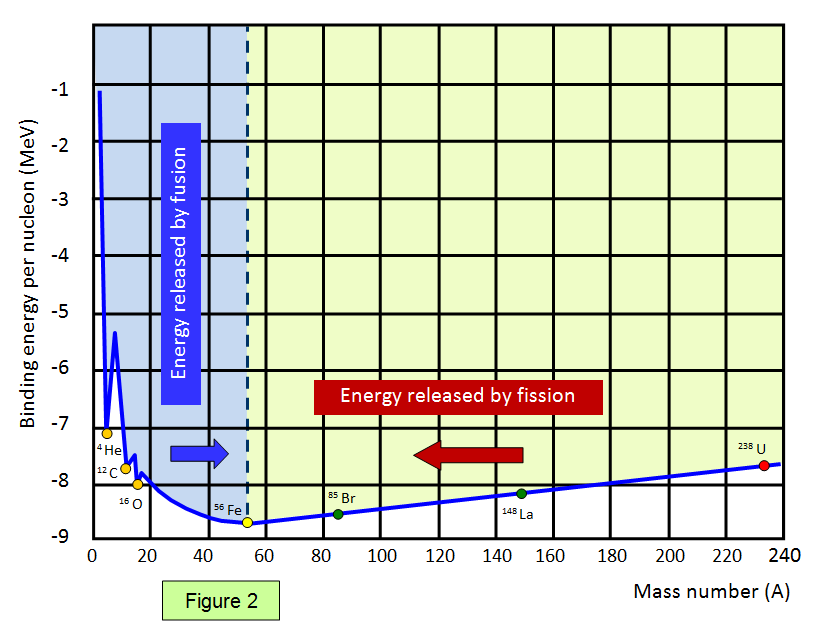
The graph below (Figure 1) shows the binding energy
per nucleon against nucleon number. Elements with a high binding energy per nucleon are very
difficult to break up. Iron 56 is close to the peak of the curve and has one of the highest binding energies per nucleon of any isotope.
(N.B the determination of the value of binding energy per nucleon for a given nucleus is a complex process and depends on the precise way it is calculated. Nickel 62, with a binding energy per nucleon of 8.7948 MeV exceeds that for iron 56 (8.7906 MeV).
The part of the curve to the left shows that two light elements
can produce energy by fusion while the part of the curve to the right shows that a heavy element
can produce energy by fission. Notice that the diagram has been drawn with the binding energies
per nucleon being shown as positive – this represents the energy needed to separate the
particles.
Therefore if a reaction takes place where the products are closer to the base
then the original nucleus (nuclei) then energy is given out.
For helium the binding energy
per nucleon is 28.3/4 = 7.1 MeV.
The helium nucleus has a high binding energy per
nucleon and is more stable than some of the other nuclei close to it in the periodic
table.
Some of the binding energies per nucleon for some common elements are shown in
the following table.
| Element | Mass of nucleons (u) | Nuclear mass (u) | Binding energy (MeV) | Binding energy per nucleon (MeV) |
| Deuterium | 2.01594 | 2.01355 | 2.23 | 1.12 |
| Helium 4 | 4.03188 | 4.00151 | 28.29 | 7.07 |
| Lithium 7 | 7.05649 | 7.01336 | 40.15 | 5.74 |
| Beryllium 9 | 9.07243 | 9.00999 | 58.13 | 6.46 |
| Iron 56 | 56.44913 | 55.92069 | 492.24 | 8.79 |
| Silver 107 | 107.86187 | 106.87934 | 915.23 | 8.55 |
| Iodine 127 | 128.02684 | 126.87544 | 1072.53 | 8.45 |
| Lead 206 | 207.67109 | 205.92952 | 1622.27 | 7.88 |
| Polonium 210 | 211.70297 | 209.93683 | 1645.16 | 7.83 |
| Uranium 235 | 236.90849 | 234.99351 | 1783.80 | 7.59 |
| Uranium 238 | 239.93448 | 238.00037 | 1801.63 | 7.57 |