
As might be expected, the coefficient of surface tension decreases with increasing temperature. It becomes zero at the critical temperature. The variation of surface tension with temperature can be studied by Jaeger's method using the apparatus shown in Figure 1.
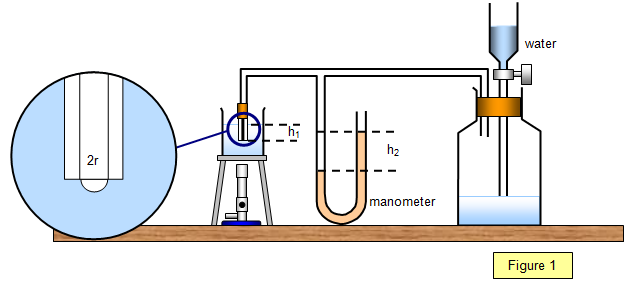
Water is allowed to drip slowly into the large
flask, so forcing bubbles of air out of the capillary tube which dips into a beaker of water. The
lower end of the capillary tube is a depth h1 below the water surface. It can be
shown that the bubble will break free from the end of the tube when its radius is equal to the
internal radius of the tube.
Using a manometer the total pressure within the
apparatus may be found; this is equal to the hydrostatic pressure (h1r1g) plus the excess
pressure within the air bubble due to the surface tension of the water. The total pressure is
given by the equation: