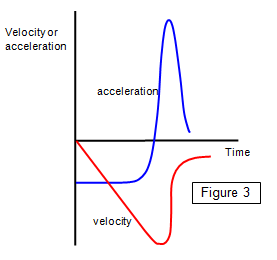
Graphs of acceleration against time can be
obtained from velocity-time graphs.
The slope of the line on a velocity-time graph at
any point (dv/dt) gives the instantaneous acceleration.
The average acceleration is
found by dividing the velocity change by the time taken.
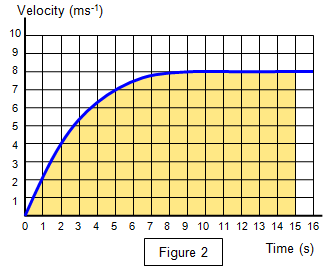
A velocity-time graph for an object moving with constant
velocity is shown in Figure 1.
The velocity of the object changes constantly with time
and so the acceleration of the object is constant and the acceleration-time graph for this
motion is a straight horizontal line.
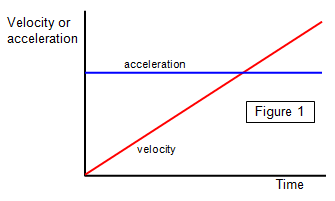
The graph in Figure 2 shows the change of velocity of a 100m
sprinter. The acceleration at any point can be found by working out the gradient of the curve
at that point.
This is looked at in more detail in:
Non-uniform acceleration