
The set of graphs in Figure 1 show how the velocity varies with time for several different situations.
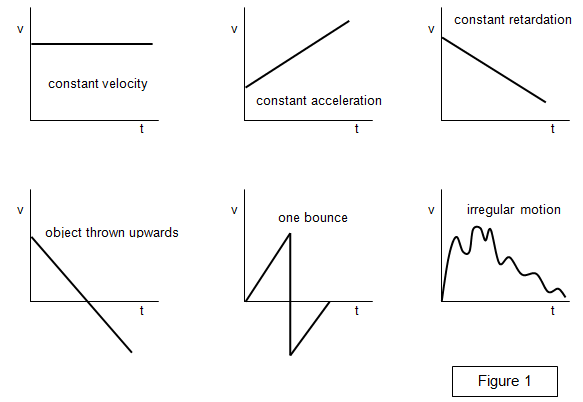
The area below the line in each graph
still represents the distance travelled in a certain time, whether the acceleration is uniform or
not.
The slope of the line at any point (dv/dt) gives the instantaneous acceleration.
The average acceleration is found by dividing the velocity change by the time
taken.