Maxwell's distribution of molecular speeds
Maxwell showed on the basis
of statistical mechanics that the actual distribution of molecular speeds within a gas was as
shown in Figure 1.
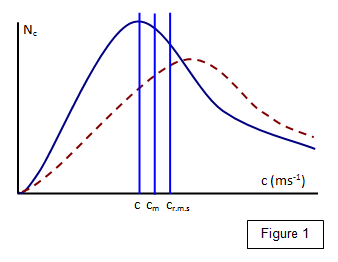
The
number of molecules N
c that have velocities between c and (c + Δc) is plotted against the velocity (c). It can be shown
that
c:c
m:c
r.m.s = 1:1.13:1.23
where c is the most
probable speed, c
m is the mean speed and c
r.m.s is the root mean square
speed.
The distribution can be investigated experimentally by passing
a stream of gaseous molecules through three rotating discs with a slot in each. The discs are
rotated on a common shaft separated by a known distance, the slots being at an angle θ to
each other. Only those molecules with the correct velocity will be able to pass through all the
slits.
A simplified diagram of the apparatus is shown Figure 2.
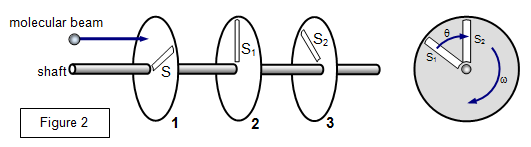
Consider a molecule that passes through S
1. If it is to pass
through S
2 then the second disc must have rotated through an angle θ during the time that the molecule was travelling between the two
discs, where θ is given by
θ = 360nt = 360L/v
where n is the number of revolutions of
the shaft per second, L the distance between the discs and v the velocity of the molecule.
Hence v can be found.
A VERSION IN WORD IS AVAILABLE ON THE SCHOOLPHYSICS CD